Written By John Lindahl
The past articles have discussed Credit trades where we opened a trade with a net credit. Specifically. We discussed Bull Puts, Bear Calls, and their combination into an Iron Condor. This article will discuss a Bull Call which is opened with a net debit.
Bull calls are used when your expectation of the market is bullish or slightly bullish. Traders will benefit from moderate rises in the equity’s price. This article explores the structure of bull call debit spread, the risk and reward, the pros and cons of the trade, the factors of when to implement the trade, and will provide an example to illustrate the use of a bull call.
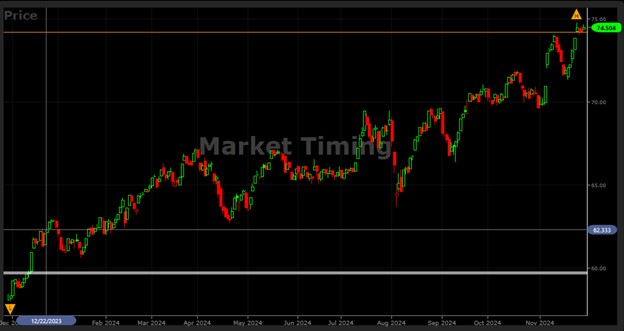
Figure 1 illustrates the VectorVest (VV) Market Timing Graph for the last year and depicts periods of bullish and slightly bullish behavior.
Structure
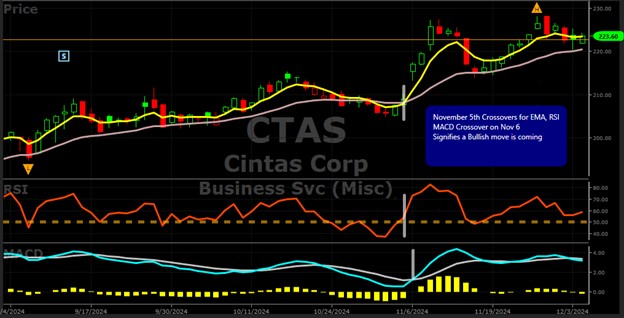
We will use a Bull Call trade that was opened on November 5th, for Cintas Corp. (CTAS) for the purpose of explaining the trade structure. The VV Market Timing Graph illustrated in Figure 1 was indicating bullish behavior. Figure 2 depicts the price action for CTAS delineating a slightly bullish trend. On November 5th we recognized the simultaneous bullish crossovers of the EMA 5 crossing above the EMA 20, the RSI rising above 50, and the MACD crossing above its signal line. These crossovers occurring within a day of each other indicate a bullish signal. With that being said, the trend had been only slightly bullish, thus a Bull Call was a great choice to enter based on these indicators.
The structure of the trade is to BTO (Buy to Open) a long call near the money and STO (Sell to Open) a short call, 1 to 2 strikes above your long call strike price with the same expiration. The premium of the lower call strike will be greater than the higher short call and will result in a net debit. Since this is a debit trade, the risk is limited to your cost basis which is the net debit. The sale of the short call reduces the cost basis, net debit, and your risk on the trade.
Table 1 depicts the Option Chain for the CTAS December 20th expiration date on November 5, 2024.
With the underlying (stock price) hovering around $208, we structured our trade around the long strike price of 210 and the short strike price at 215. Using the midpoints of the Bid and Ask data (far right columns), the trade structure is as follows
BTO Dec 20 Strike 210 – $7.25
STO Dec 20 Strike 215 – $5.00
Net Debit = Max Risk = (7.25 – 5.00) = $2.25
Max Profit = (Spread – Net Debit) = 5.00 – 2.25 = $2.75
Max ROI = Max Profit/Max Risk = 2.75/2.25 = 122%
Trade Duration for Max Profit – 45 days
It should be noted that Max Profit occurs at expiration when the underlying price is at or above the short strike price. While this provides the max profit and max ROI, it is often advisable to set a smaller profit goal that can be realized at an earlier date. This is done by setting a profit goal and selling the spread once that target is achieved. In the example above, we might choose a 25% Profit goal. This would set our profit margin at 25% of the Max Risk or Net Debit.
Profit Margin Goal = (0.25 * 2.25) = $0.56
In this instance, we would look to sell the Bull Call spread at $2.81 or higher, prior to expiration, upon reaching this target. Reviewing Figure 2 above, we see that the underlying price of CTAS rose steeply in the ensuing days after our indicators gave us the bullish signal. Table 2 delineates the option prices for November 8th.
Using the midpoints of the Bid and Ask prices on November 8, 2024, we sold the spread in 3 days with the following actions:
STC (Sell to Close) Dec. 20 Strike 210 @ $14.30
BTC (Buy to Close) Dec 20 Strike @ $10.75
Net Credit = 14.30 – 10.75 = $3.55
While our goal was to make a $0.56 profit, the stock rose sharply, and we over-achieved our 25% goal and realized a profit of $1.30 (3.55 – 2.25) which when compared to our initial net debit of $2.25 gave us a 3-Day profit margin of:
Profit Margin = 1.30 / 2.25 = 58%.
Advantages (Pros) and Disadvantages (Cons) of a Bull Call
After selecting an underlying position and determining its’ trend, be it bullish, bearish, or neutral, a trader has a bevy of options to consider in terms of defining the type of trade to select. Factors to consider include cost, risk, confidence, return, duration of the trade, and upcoming events that might influence the trade. Thus, it is important to understand the Pros and Cons of a Bull Put.
Advantages or Pros
The main advantage of buying a Bull Call spread is that it costs less than buying a long call. The premium that is taken in from the sale of the short call reduces the price of the trade and thus lowers the risk. The maximum loss that can occur is limited to the net debit which has been reduced by the short call. In the CTAS example, the cost of the long call was $7.25, but by selling the short call, we reduced our net debit and max risk by $5.00 to $2.25. Thus, by using the spread, we were able to limit our potential loss.
Disadvantages or Cons
The disadvantages of Bull Call spreads lie within the fact that the profit of the trade is capped to the difference in the strike prices (spread) minus the net debit. The spread in the CTAS example was $5.00 and the net debit was $2.25. Thus, regardless of how high the underlying rose, the profit would be capped at $2.75.
Conclusion
Bull call trades are excellent choices when the market is not rising sharply. The risk is limited and while the profit is also capped, the ROI goals are often set below the max profit and can be realized in short order. Depending on the price of the underlying, option prices can be high and since 1 contract (minimum purchase of options) consists of 100 shares, the initial investment can be high. By implementing this strategy, it allows traders to participate in the movement of higher priced stocks and options. In the case of the CTAS example, if a straight long call had been purchased, the initial cost of 1 contract would have been $725 versus $225 for the spread.
Want These Types of Insights at Your Fingertips so You Can Win More Trades?
Use VectorVest to analyze any stock free. VectorVest is the only stock analysis tool and portfolio management system that analyzes, ranks and graphs over 18,000 stocks each day for value, safety, and timing and gives a clear buy, sell or hold rating on every stock, every day.
Before you invest, check VectorVest! Click here to ANALYZE ANY STOCK FREE and see our system in action!


Leave A Comment