
Goldman Sachs (GS) reported its second-quarter earnings Monday morning, sending shares higher on the heels of earnings and revenue beats.
The company benefited from an increase to fixed income trading along with lower loan loss provisions than originally anticipated. Here are the Q2 results along with the analyst estimates:
- Earnings: $8.62/share vs $8.34/share expected.
- Revenue: $12.73 billion vs $12.46 billion expected.
The biggest takeaway from the report was the massive spike in profitability year over year. That earnings figure is tied to a second-quarter profit of $3.04 billion, which represented a 150% jump.
However, it appears this had less to do with impressive performance in Q2 2024 and more to do with last year’s results being held back by write-downs associated with commercial real estate and selling a consumer business.
Revenue was up for the quarter as well at 17% YoY. The bank’s primary trading, advisory, and asset & wealth management segments showed improvements. Fixed income trading saw its own 17% jump specifically. This segment was $220 million higher than the expectation.
While this was definitely the turnaround the bank needed after an abysmal 2023 performance, the expectations are set higher for Goldman Sachs.
Since hitting a low point of just $289/share in October of last year, the road to recovery has been well underway. GS sits at $486/share and has gained more than 27% through 2024 thus far.
Earnings aside, we’ve taken a look at this opportunity through the VectorVest stock analysis software and found 3 things that point towards this stock being a BUY today. Here they are…
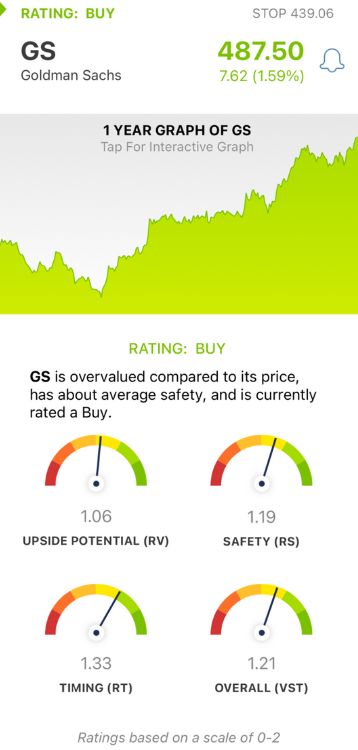
GS Has Fair Upside Potential With Good Safety and Very Good Timing
VectorVest simplifies your trading strategy by delivering all the insights you need to make calculated, emotionless decisions in just 3 ratings. These are relative value (RV), relative safety (RS), and relative timing (RT).
Each sits on a scale of 0.00-2.00 with 1.00 being the average, making interpretation quick and easy. You can start winning more trades with less work by simply choosing safe, undervalued stocks rising in price. It’s really that easy!
But, it gets even easier. You’re given a buy, sell, or hold recommendation for any given stock at any given time based on its overall VST rating. Here’s what we found for GS:
- Fair Upside Potential: The RV rating compares a stock’s long-term price appreciation potential (forecasted 3 years out), AAA corporate bond rates, and risk. This is a far superior indicator than the typical comparison of price to value alone. GS has a far RV rating of 1.06.
- Good Safety: The RS rating is a risk indicator. It’s computed from an analysis of the company’s financial consistency & predictability, debt-to-equity ratio, business longevity, sales volume, price volatility, and other factors. GS has a good RS rating of 1.19.
- Very Good Timing: The RT rating is based on the direction, dynamics, and magnitude of the stock’s price movement. This trend indicator is taken day over day, week over week, quarter over quarter, and year over year. GS has a very good RT rating of 1.33.
The overall VST rating of 1.21 is good for GS, and enough to earn the stock a BUY recommendation in the VectorVest system. Take a moment to review this free stock analysis before you make your next move and set yourself up for a profitable trade with as little work as possible!


Want These Types of Insights at Your Fingertips so You Can Win More Trades?
Use VectorVest to analyze any stock free. VectorVest is the only stock analysis tool and portfolio management system that analyzes, ranks and graphs over 18,000 stocks each day for value, safety, and timing and gives a clear buy, sell or hold rating on every stock, every day.
VectorVest advocates buying safe, undervalued stocks, rising in price. GS beat the analyst expectations on the top and bottom lines for Q2, and the stock itself is up 27% since the start of the year. It has far upside potential, good safety, and very good timing.
Before you invest, check VectorVest! Click here to ANALYZE ANY STOCK FREE and see our system in action!


Leave A Comment