Sam Adams, Twisted Tea, Truly, Angry Orchard…you may know all these different brands of beer, seltzer, and cider on their own. But did you know that they’re all owned by one company – Boston Beer? And as of this morning, Boston Beer (SAM) is trading up 16% and counting as of 11 am EST. We’ll explore the reason for this spike below – and help you determine what your next move should be as an investor.
The pump we’re witnessing this morning for Boston Beer was the result of an impressive 3rd quarter earnings report. The company beat expectations in many categories – but perhaps more importantly, returned to profits.
The alcoholic beverage manufacturer reported revenue of $596.5 million – which dramatically beat estimates. This was a 6.2% gain year over year, as the company has taken massive strides to grow the top line. But the bottom line has improved as well. Boston Beer was able to cut advertising, promotional, and selling costs while increasing prices, contributing to a gross profit change year over year just shy of 50%.
Boston Beer also beat estimated adjusted earnings per share, another reason for the big boost the stock is seeing this morning. Analysts were anticipating $3.16/share and the reported adjusted EPS came in at $3.82/share.
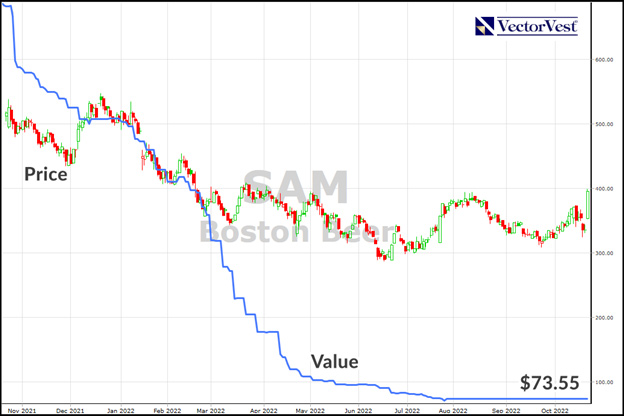
While the last year hasn’t necessarily been positive for Boston Beer (down 24% in the past 365-day period), they have been gaining momentum in the right direction for a while now. The stock price of $289/share in June was a low point – and it’s rebounded since. Today, it sits nearly $100 higher than just 4 months ago at a share price of $387.22.
Boston Beer is optimistic about the remainder of the year, too. Chairman and founder Jim Koch believes the long-term growth outlook remains positive for his company’s diversified alcoholic beverage portfolio. In fact, he expects EPS to fall between $7-$10/share for fiscal 2022 EPS.
Thus, this pump we’re seeing today may not be the last for Boston Beer this year. They are positioned to finish Q4 even stronger.
But – does that mean you should enter your position today, or is the current stock price too high to really gain much value? If you’re currently invested in SAM stock, is this high point a good opportunity to sell and capture profits?
To gain a clear answer on what your next move with SAM stock should be, read on below as we analyze the current situation through VectorVest’s tried-and-true form of stock analysis.
Does Good Timing Outweigh Very Poor Upside Potential – or Vice Versa?
The VectorVest stock forecasting system simplifies trading by telling investors everything they need to know about a stock in just three easy-to-understand ratings: relative value (RV), relative safety (RS), and relative timing (RT). These sit on a scale of 0.00-2.00, allowing for effortless interpretation. The higher a rating is on that scale, the better – with 1.00 being the average.
Based on the culmination of these three ratings, VectorVest provides an overall VST rating – along with a clear buy, sell, or hold recommendation. This allows you to eliminate emotion or guesswork from your strategy and execute trades in confidence. So – what’s going on with SAM right now?
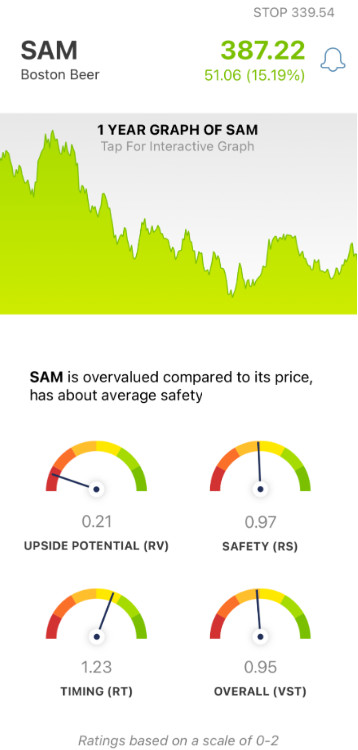
- Very Poor Upside Potential: RV is an indicator of long-term price appreciation potential – projected up to three years out. And this is the biggest issue with SAM stock right now – the RV rating of 0.21 is very poor. Moreover, the stock is way overvalued at the current price of $387.22. VectorVest calculates the current value to be just $73.55.
- Fair Safety: An indicator of risk, RS looks at a company’s financial consistency and predictability, debt-to-equity ratio, and business longevity. All things considered, SAM has a fair RS rating of 0.97 – right around the average.
- Good Timing: Here’s where things get interesting for speculative investors. Despite the very poor upside potential for this stock, the timing is good – with an RT rating of 1.23. This rating looks at the direction, dynamics, and magnitude of a stock’s price trend. And this rating isn’t just taking a look at today’s pump – it factors in movement day over day, week over week, quarter over quarter, and year over year.
Taking all three ratings into account, VectorVest provides an overall VST rating of just 0.95 – which is fair.
Now the question becomes – should you buy despite the very poor upside potential to ride this trend? Or, should you wait for further confirmation of the price trend before making a move?
You don’t have to wonder any longer – get a free stock analysis today and discover a clear answer to what you should do with SAM!
Want These Types of Insights at Your Fingertips so You Can Win More Trades?
Use VectorVest to Analyze any stock free. VectorVest is the only stock analysis tool and portfolio management system that analyzes, ranks and graphs over 18,000 stocks each day for value, safety, and timing and gives a clear buy, sell or hold rating on every stock, every day.
VectorVest advocates buying safe, undervalued stocks, rising in price. As for SAM, it is overvalued with very poor upside potential, and has just fair safety – but it has good timing.
Before you invest, check VectorVest! Click here to ANALYZE ANY STOCK FREE and see our system in action!


Leave A Comment