In Chapter 9 (Timing: The Ultimate Weapon) of Dr. DiLiddo’s classic book “Stocks, Strategies & Common Sense,” he states that “While an understanding of stock value and safety are vital for appropriate stock selection, a knowledge of technical analysis and timing is essential for knowing when to buy and sell.”
The VectorVest proprietary technical indicator that helps us determine when to buy a stock is RT (Relative Timing).
There is another powerful VectorVest proprietary indicator CI (Comfort Index) which, when used together with RT, greatly enhances our ability to pick winning stocks.
RT is a short-term technical indicator that looks at the direction, magnitude and dynamics of a stock’s price movement day-over-day, week-over-week, quarter-over-quarter and year-over-year. We favour stocks with a rising RT. This indicator is on a scale of 0.00-2.00, the higher above 1.00, the more favourable and the further below 1.00, the more unfavourable. This indicator must be graphed to see the trend of RT and we prefer stocks with RT > 1.00 and trending higher rather than stocks with RT still above 1.00, but trending lower. You may wish to look at a graph of BIG.AX. Go to Graphs on the main toolbar, then type BIG.AX in the box beside Stock on the upper left of the screen. RT broke back above 1.00 on 26 September 2017 at a Price of $1.38 per share and went on to hit a Price of $4.00 per share on 15 November 2017.
CI is an indicator of a stock’s long-term price stability. It looks at a stock’s ability to resist severe and/or lengthy price declines and is also on a scale of 0.00-2.00. The higher the score, the smoother the trend of the stock’s graph. A great example of a stock with consistently rising CI over recent months has been CGC.AX, where CI broke above 1.00 on 7 October 2015 with the Price at $2.26 per share. The Price as of 15 November 2017 is $6.78 per share and CI remains well above 1.00.
We can combine RT and CI into one indicator to identify the stocks in the VectorVest database with the best combination of short-term price momentum and long-term price stability. To do this we rank all the stocks in Stock Viewer by RT * CI by simply clicking on Viewers on the main toolbar, clicking on Stock Viewer and then clicking on the tab (VST DESC, Symbol ASC) just above the date box at the top left of Stock Viewer. This opens a box called Edit Sort. Go below that title to Primary Sort, then click on the drop-down arrow to the right of VST and select RT * CI. Leave this sort as DESC and also leave the Secondary Sort as Symbol ASC. Click OK.
We will apply this technique to finding winning stocks in a rising market. At VectorVest, we believe in buying stocks that are rising in price when the market is going up; no prizes for guessing what is likely to happen!
Find out what a share is really worth
The best way to establish if the market is in a rising trend is to go to the Market Timing Graph (by clicking on the Timing tab on the main toolbar and then clicking on the Market Timing Graph). You can then select the appropriate Market Timing signal that works best for your investment style. At the very left-hand bottom of the Market Timing Graph, to the left of “Last Close,” there is a drop-down arrow. If you click on this arrow you will see the different VectorVest Market Timing signals. We will use the most conservative and one of our most popular Market Timing signals; Confirmed Calls. The last Confirmed Up, C/Up, signal was given on 9 October 2017.
We now return to Stock Viewer, ensuring we rank all the stocks by RT * CI and set our date to our C/Up signal of 9 October 2017 in the date box. If we click on QuickTest at the top of the Stock Viewer and test the Top 20 from this date to 15 November 2017 (about 5 weeks), we get a return of 16.69% (compared to the VVC/AU returning 4.44%) with 14 Winners and 6 Losers. Note, however, the number of penny stocks in the top 20. If we QuickTest the Top 10, we show a profit of 25.87%, with 7 Winners and 3 Losers and there are no penny stocks. Going with our preferred number of stocks in Australia, the Top 5, a QuickTest shows a profit of 50.80% with 4 Winners and 1 Loser.
This shows some explosive results with the potential for significant returns in a matter of only 5 weeks! Our strategy was a purely technical play to identify the stocks with the best long-term price performance moving up the quickest in a rising market. We did no fundamental analysis; you will note a number of the stocks that came up were overvalued with poor RV and RS and, as such, this approach is likely to suit the more aggressive trader.
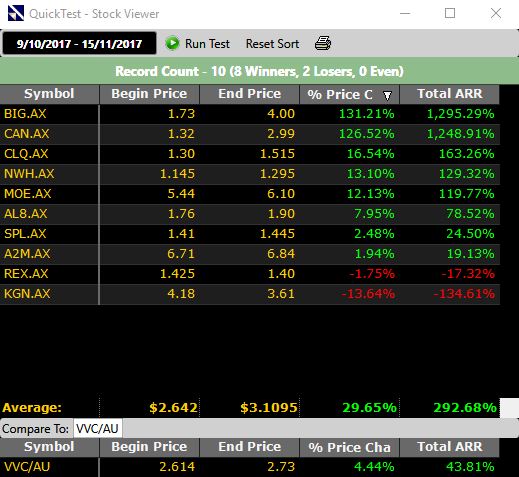
If we wish to take a more conservative approach, we can use both fundamental and technical analysis. We will still harness the power of RT and CI and then combine this with our Master Indicator, VST, to address stock value and safety by ranking all the stocks in Stock Viewer by RT * CI * VST. To do this, we must create a Custom Field. Click on Tools on the main tool bar, the click on Custom Field Builder. In the Custom Field Builder box, type RT * CI * VST in the Field Name box. To create the field, click on Fields, Capital Appreciation, RT, then click on the *. Repeat the previous step to add CI and VST. Click on Validate, click OK, click on Save Changes and Exit. Now you can find the custom sort. QuickTest the Top 10 stocks and you will see a return of 29.65% with 8 Winners and 2 Losers. If we are looking for the safest stocks with explosive upside potential, we can remove the stocks in the Top 10 with RS < 1.00. Eliminating these gives us a return of 20.78%.
Not bad results for very little work! We trust this exercise has given you some great ideas on how to use VectorVest’s amazing functionality to find winning stocks.
Written by: Robert and Russell Markham


Good day ,
It is a very great strategy my question is the following regarding the stops using this strategy usually when you go out from a position. thank you